htl-manure-lca
Master thesis: Life cycle assessment of biocrude production from livestock manure in Germany via hydrothermal liquefaction
Open the interactive findings page · Watch the plant in motion
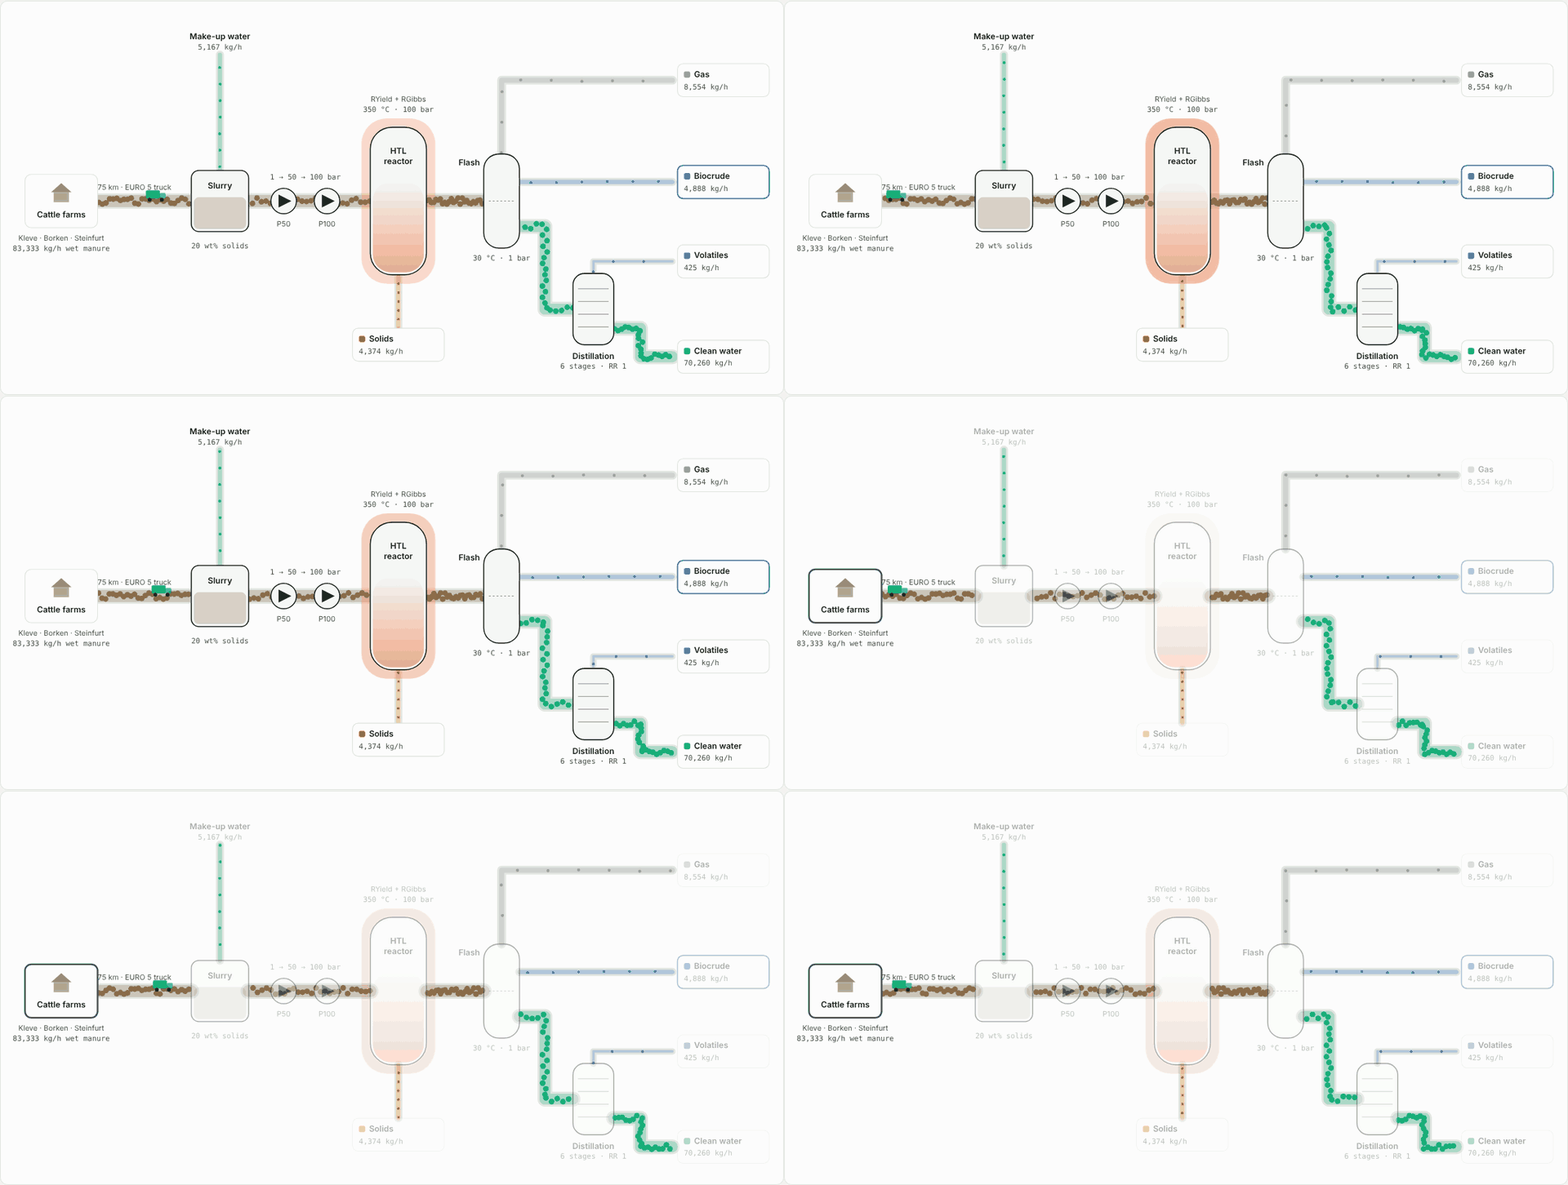
My Master thesis rebuilt as reusable data, Python code and charts. It covers the Aspen Plus process models, life cycle inventory and life cycle assessment of biocrude from cattle manure by hydrothermal liquefaction (HTL) in Germany.
Komal Mallesh Chougule, Life cycle assessment of Biocrude Production from Livestock manure in Germany via Hydrothermal Liquefaction. MSc thesis, Groundwater Management, TU Bergakademie Freiberg, 2022. Supervisors: Prof. Dr. J. Bongaerts, Dr. M. Alherbawi.
The study in one picture
flowchart LR
    F[Cattle manure<br/>Kleve, Borken, Steinfurt] -->|diesel truck, 75 km| P[Pre-processing<br/>20 wt% slurry]
    P --> H[Hydrothermal liquefaction<br/>350 °C, 100 bar]
    H --> B([1 kg biocrude])
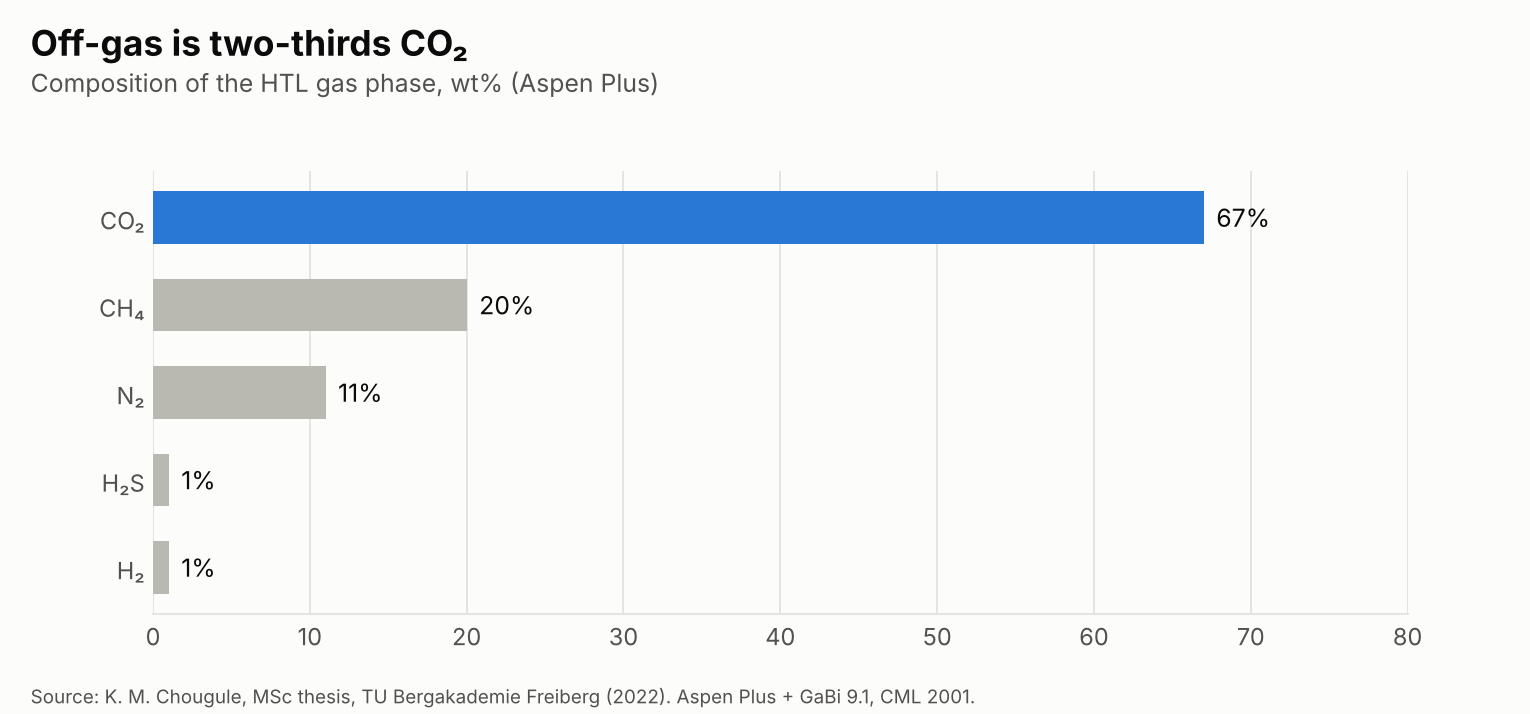
    H --> G[Gas: CO₂, CH₄, N₂]
    H --> S[Solids: char + ash]
    H --> A[Aqueous phase]
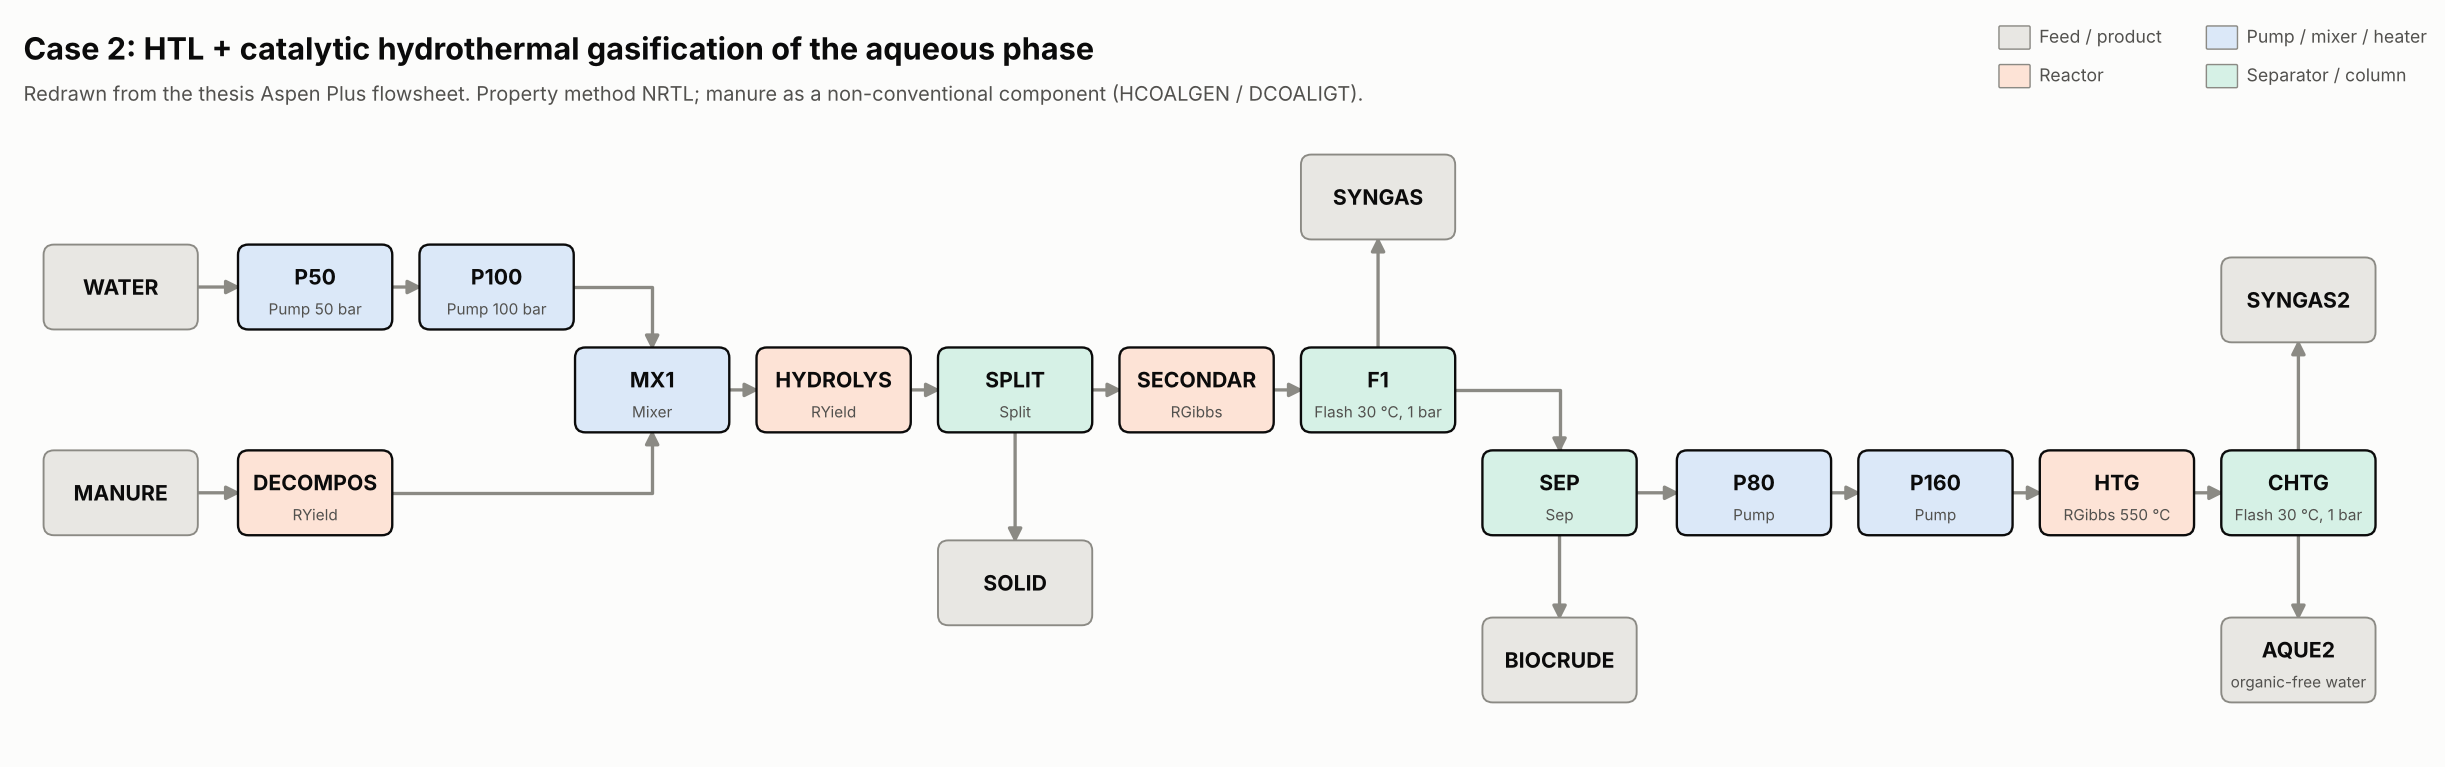
    A -->|Case 2| CHG[Catalytic hydrothermal<br/>gasification]
    A -->|Case 3| FD[Fractional<br/>distillation]
    CHG --> W([Clean water])
    FD --> W
Three process configurations were modelled in Aspen Plus, each with wind or German grid electricity, and assessed in GaBi 9.1 with CML 2001 for a functional unit of 1 kg of biocrude, cradle to gate.
Key results
| Per 1 kg of bio-oil | Case 1: HTL | Case 2: HTL + HTG | Case 3: HTL + FD |
|---|---|---|---|
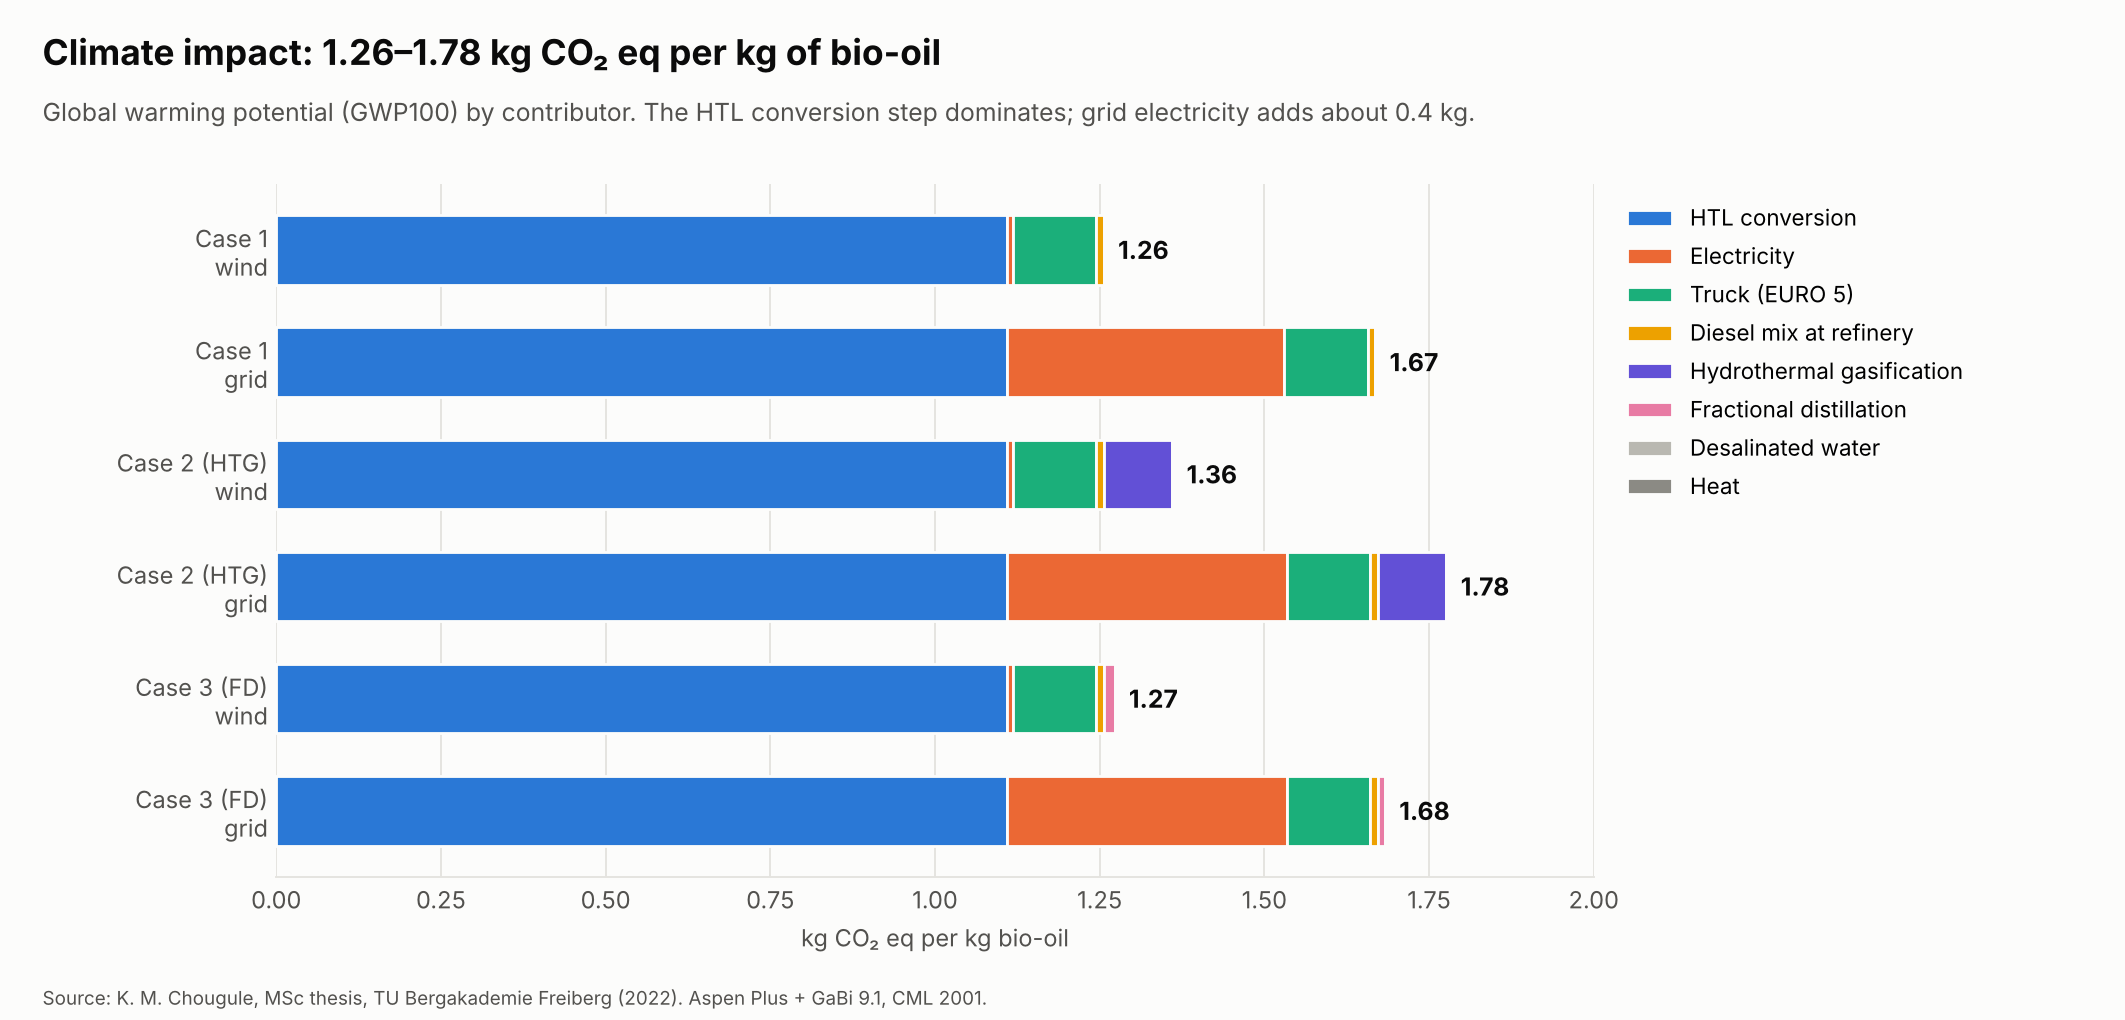
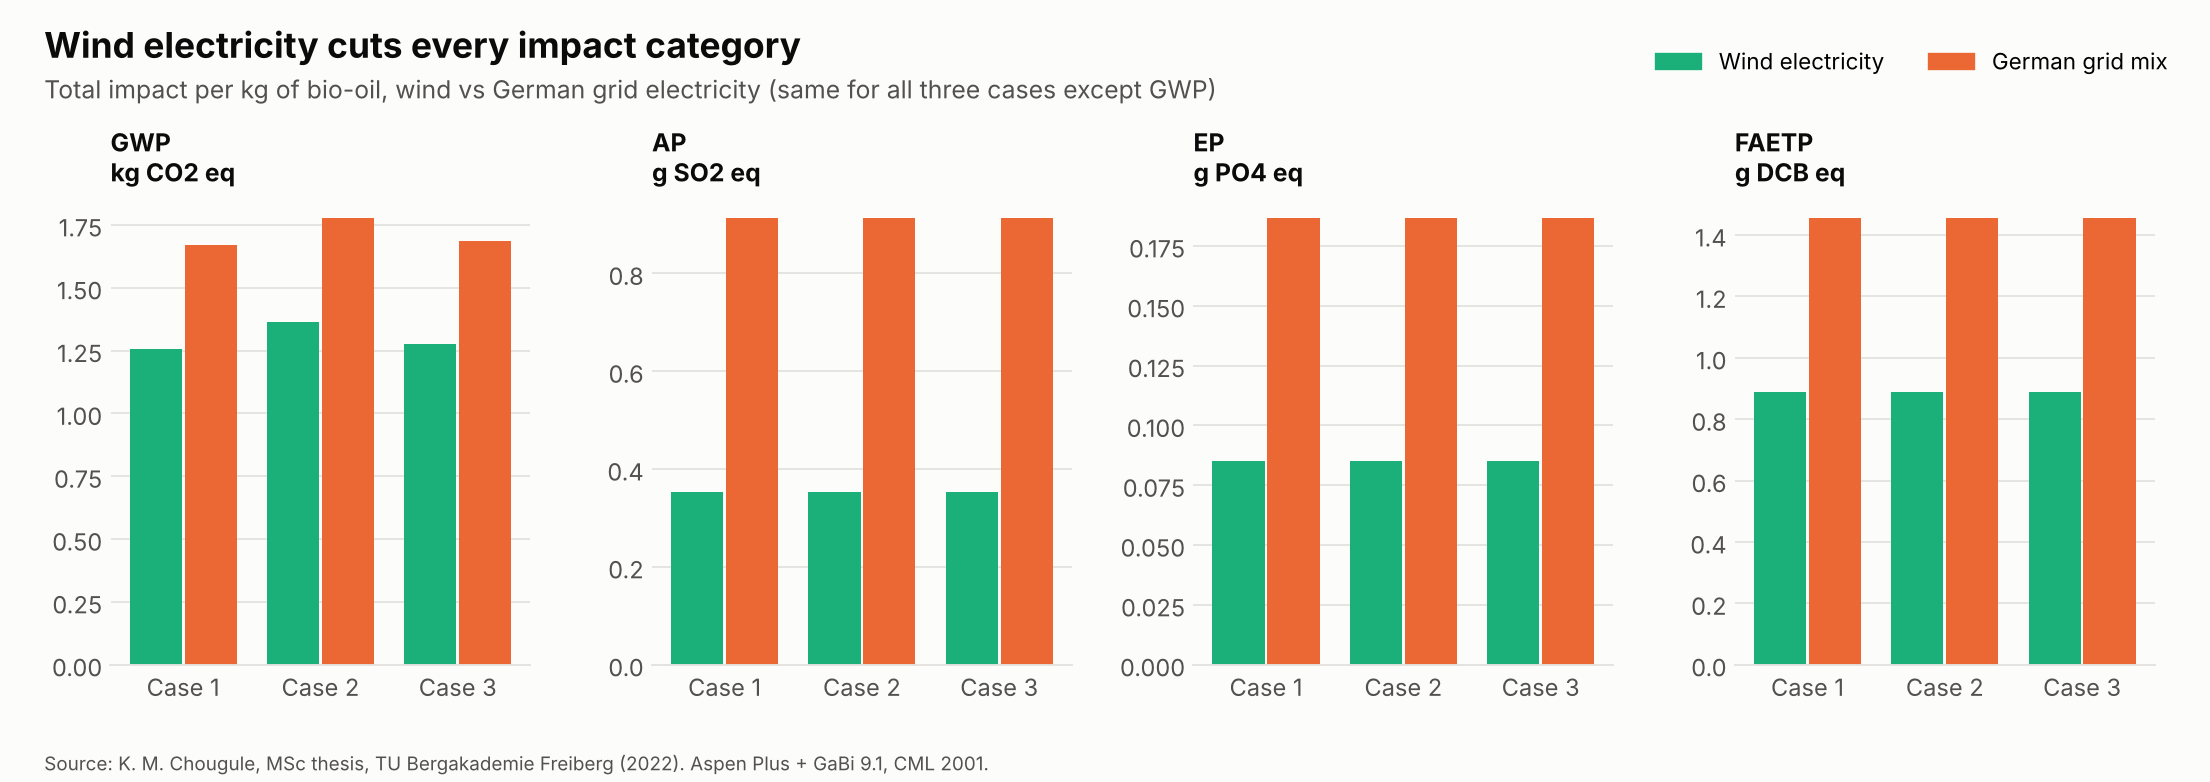
| GWP, wind electricity (kg CO₂ eq) | 1.26 | 1.36 | 1.27 |
| GWP, German grid (kg CO₂ eq) | 1.67 | 1.78 | 1.68 |
| Acidification, wind / grid (g SO₂ eq) | 0.35 / 0.91 | 0.35 / 0.91 | 0.35 / 0.91 |
| Eutrophication, wind / grid (g PO₄ eq) | 0.085 / 0.187 | 0.085 / 0.187 | 0.085 / 0.187 |
| Freshwater ecotoxicity, wind / grid (g DCB eq) | 0.89 / 1.46 | 0.89 / 1.46 | 0.89 / 1.46 |
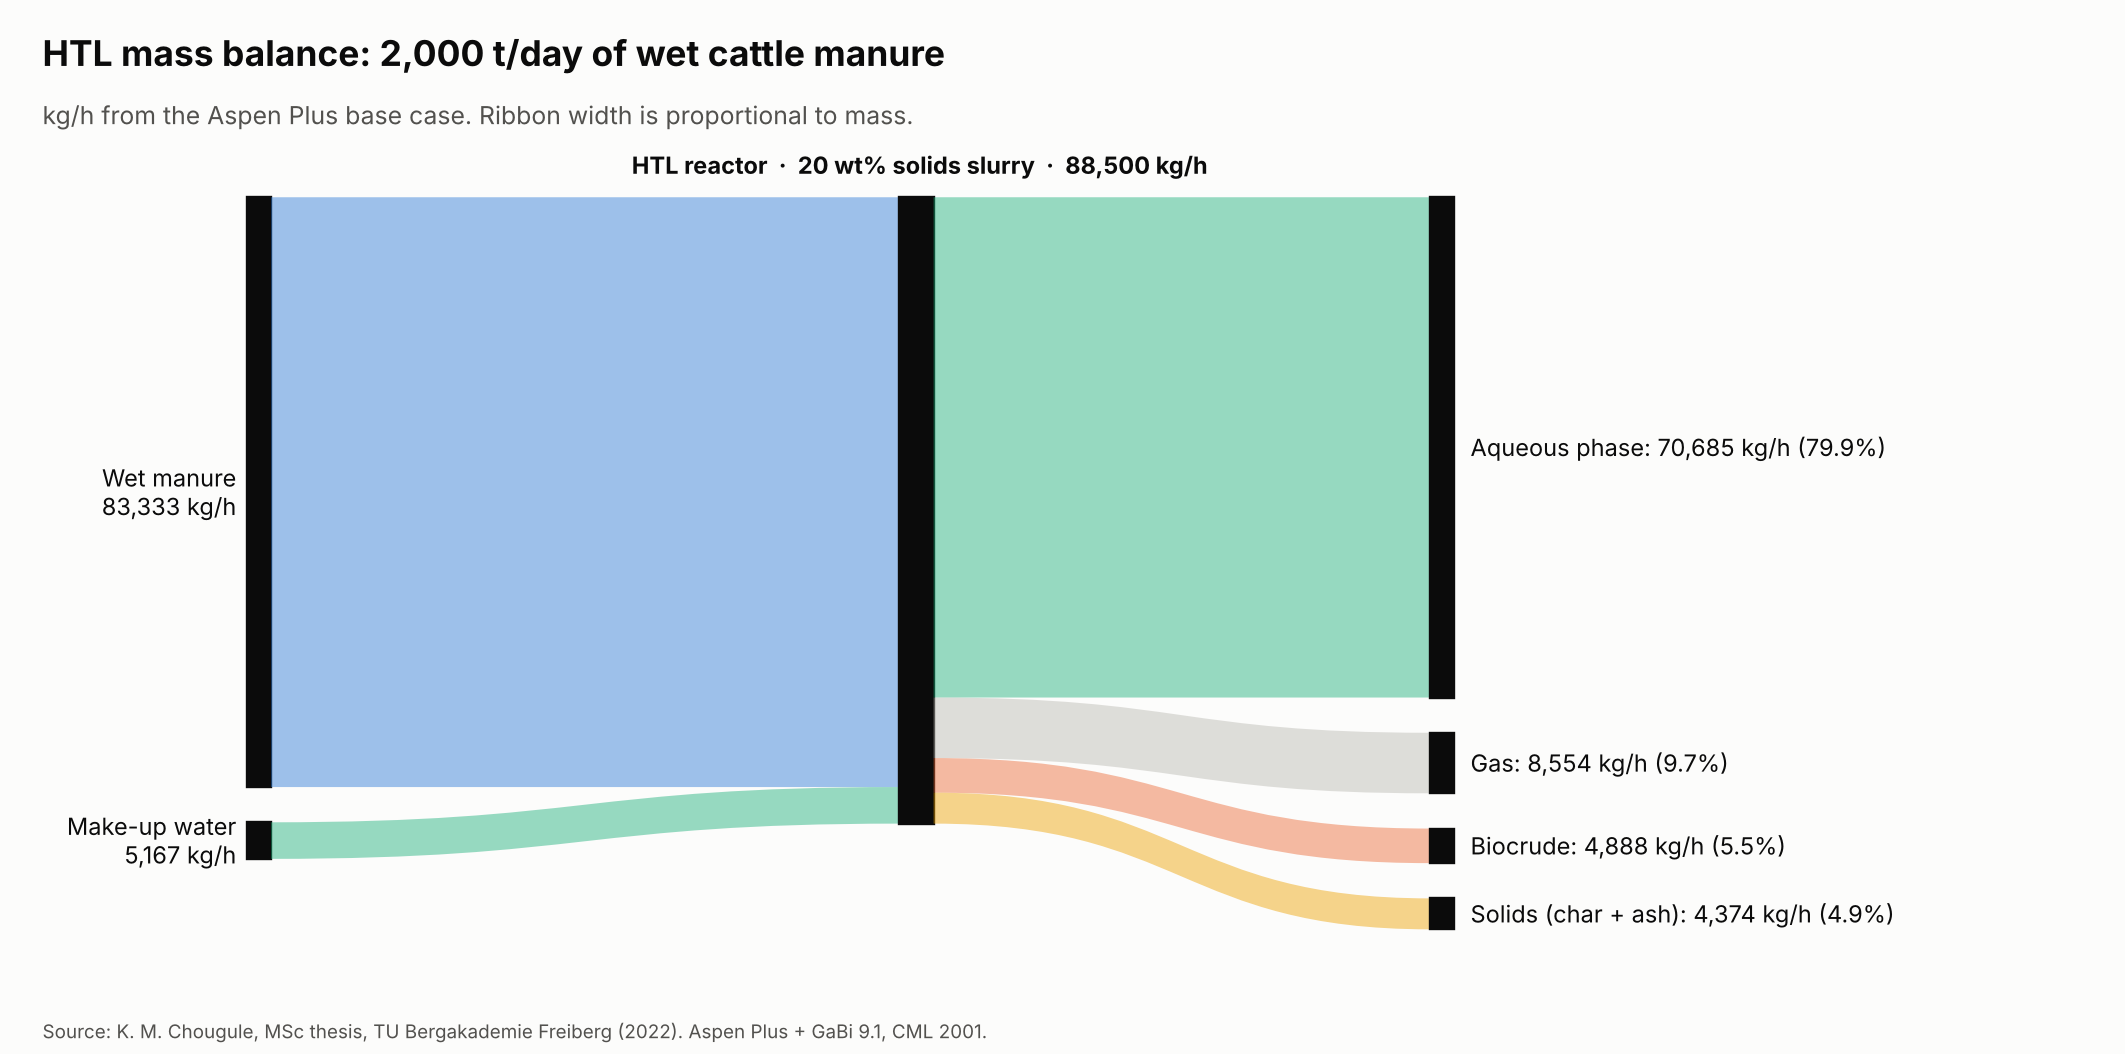
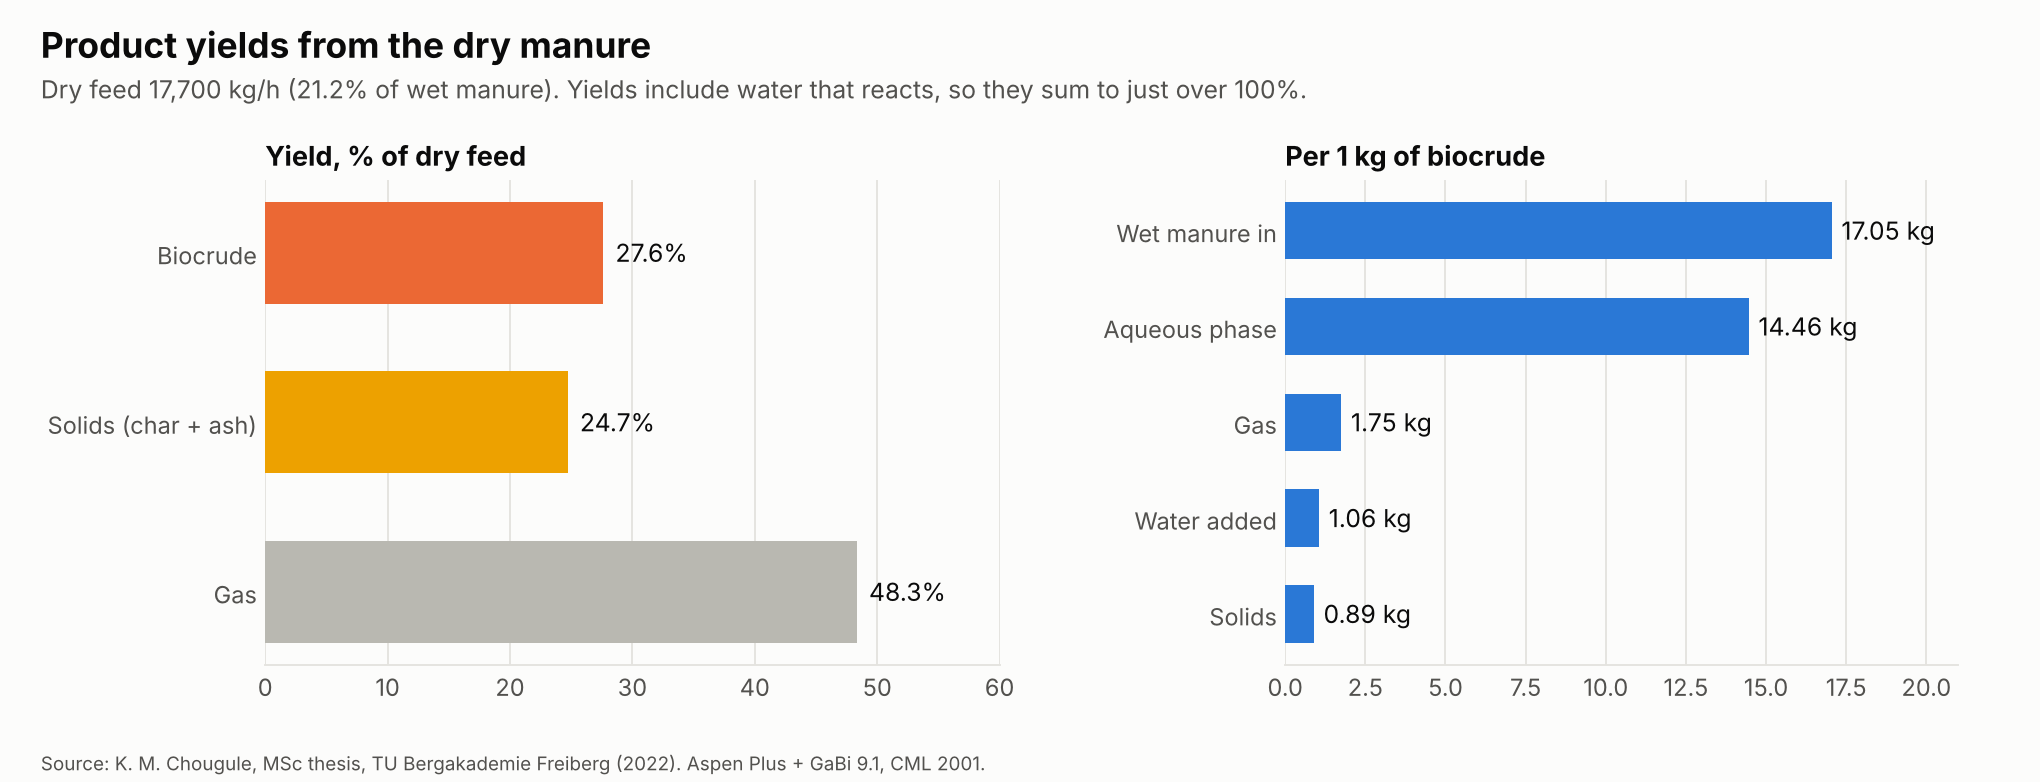
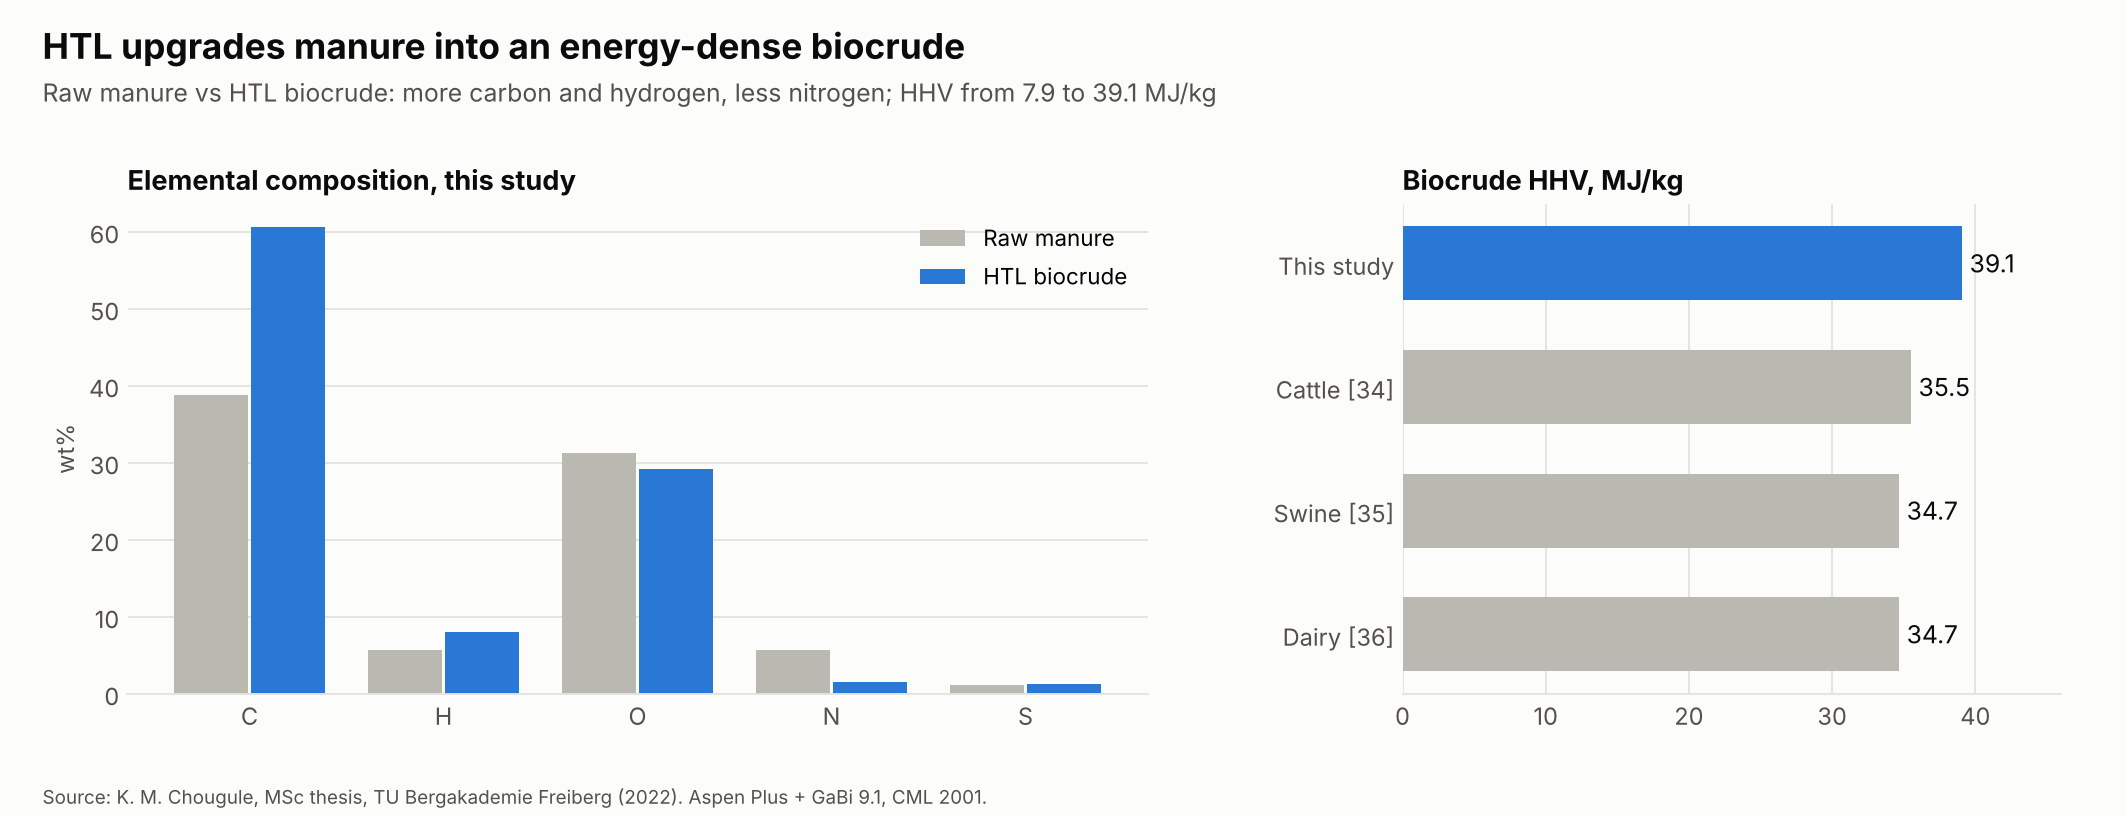
- Biocrude yield: 27.6% of the dry manure, with an HHV of 39.1 MJ/kg in Aspen Plus. The plant makes 4,888 kg/h from 2,000 t/day of wet manure.
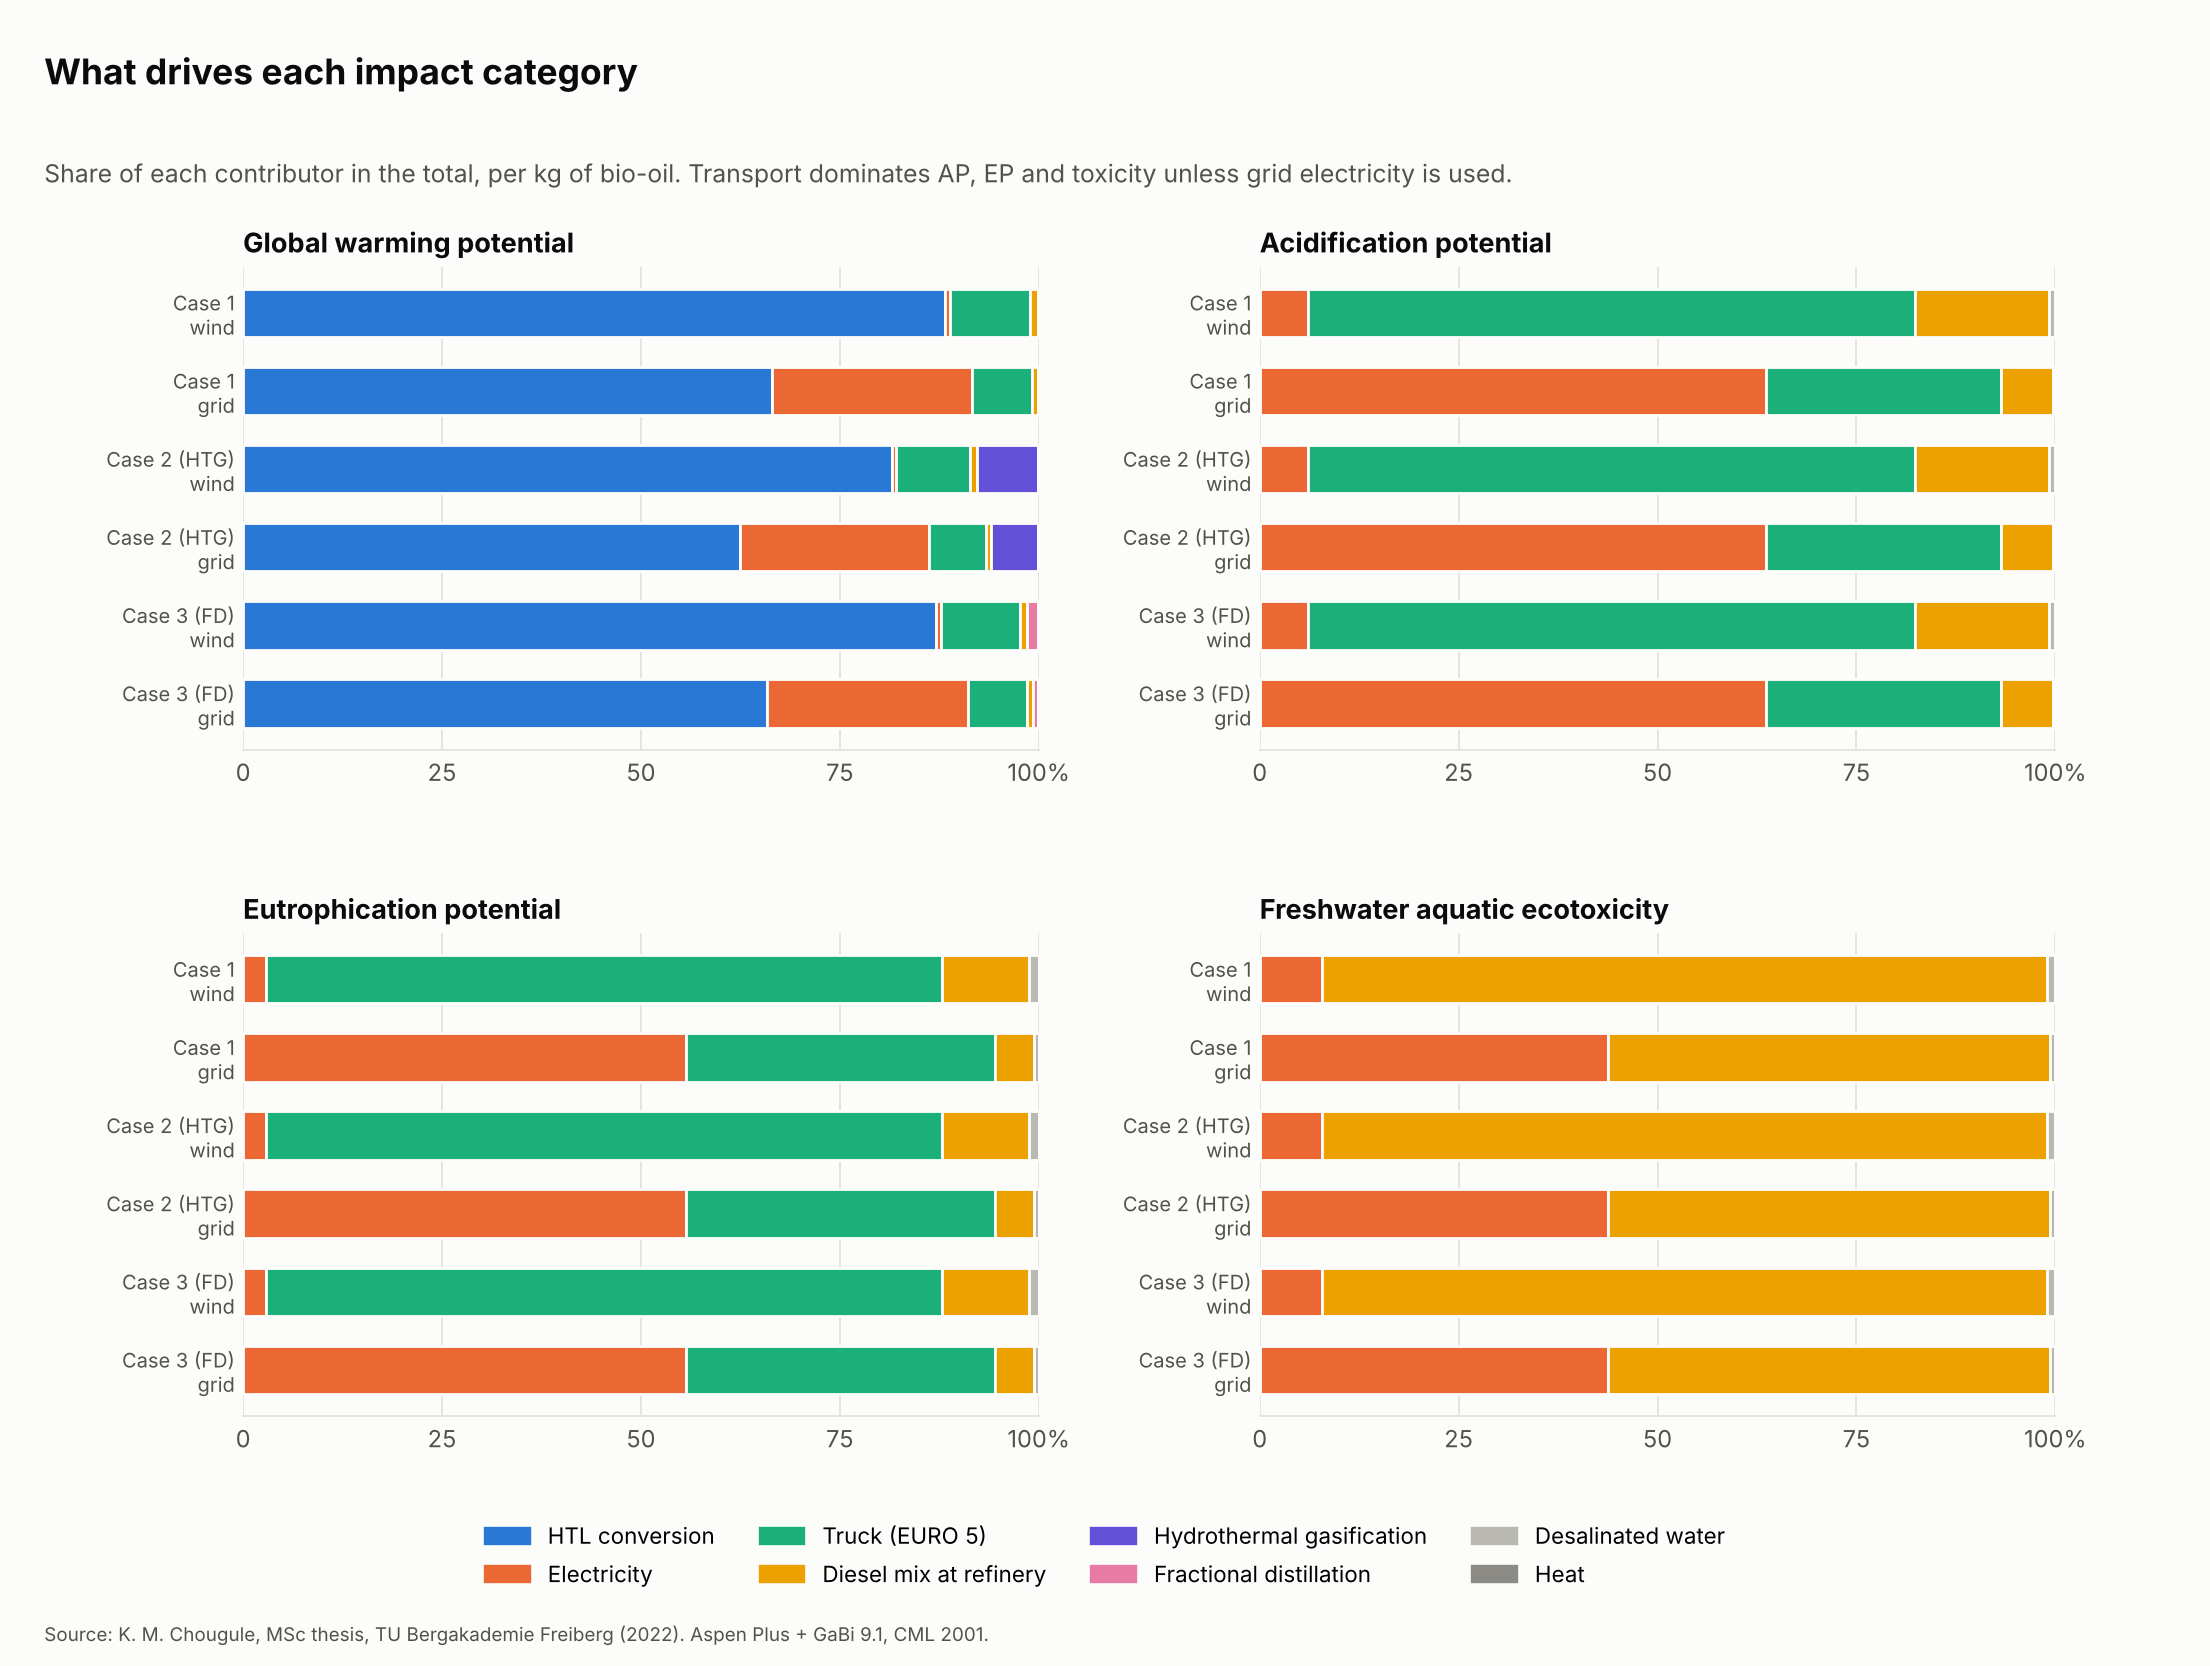
- The HTL conversion step causes 62–88% of the climate impact. Grid electricity adds about 0.4 kg CO₂ eq.
- Diesel trucks dominate acidification, eutrophication and toxicity when the electricity comes from wind.
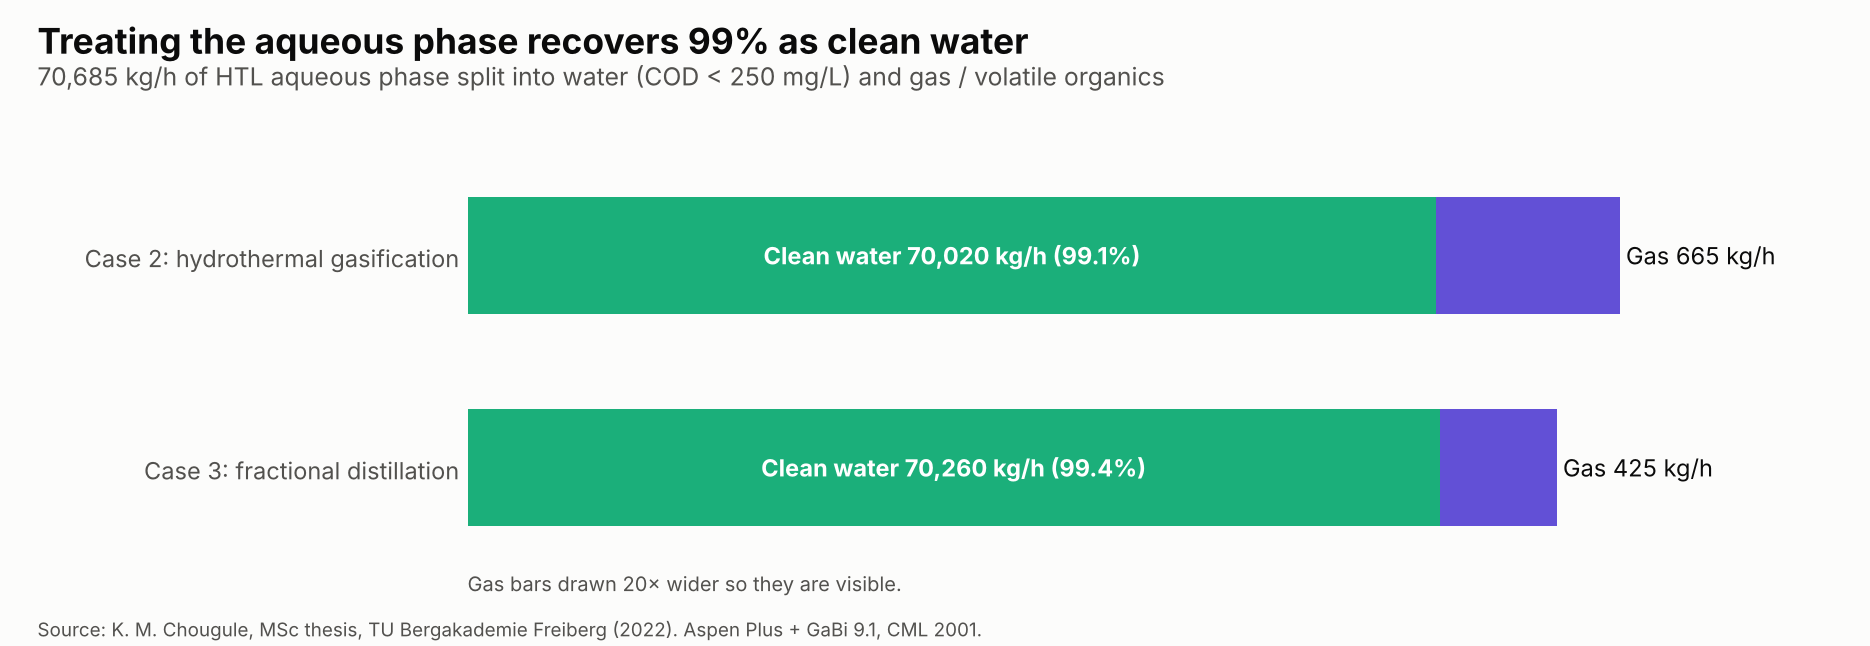
- Treating the aqueous phase recovers about 99% of it as clean water (COD < 250 mg/L). Distillation (case 3) adds less to GWP than gasification (case 2).
KPI framework
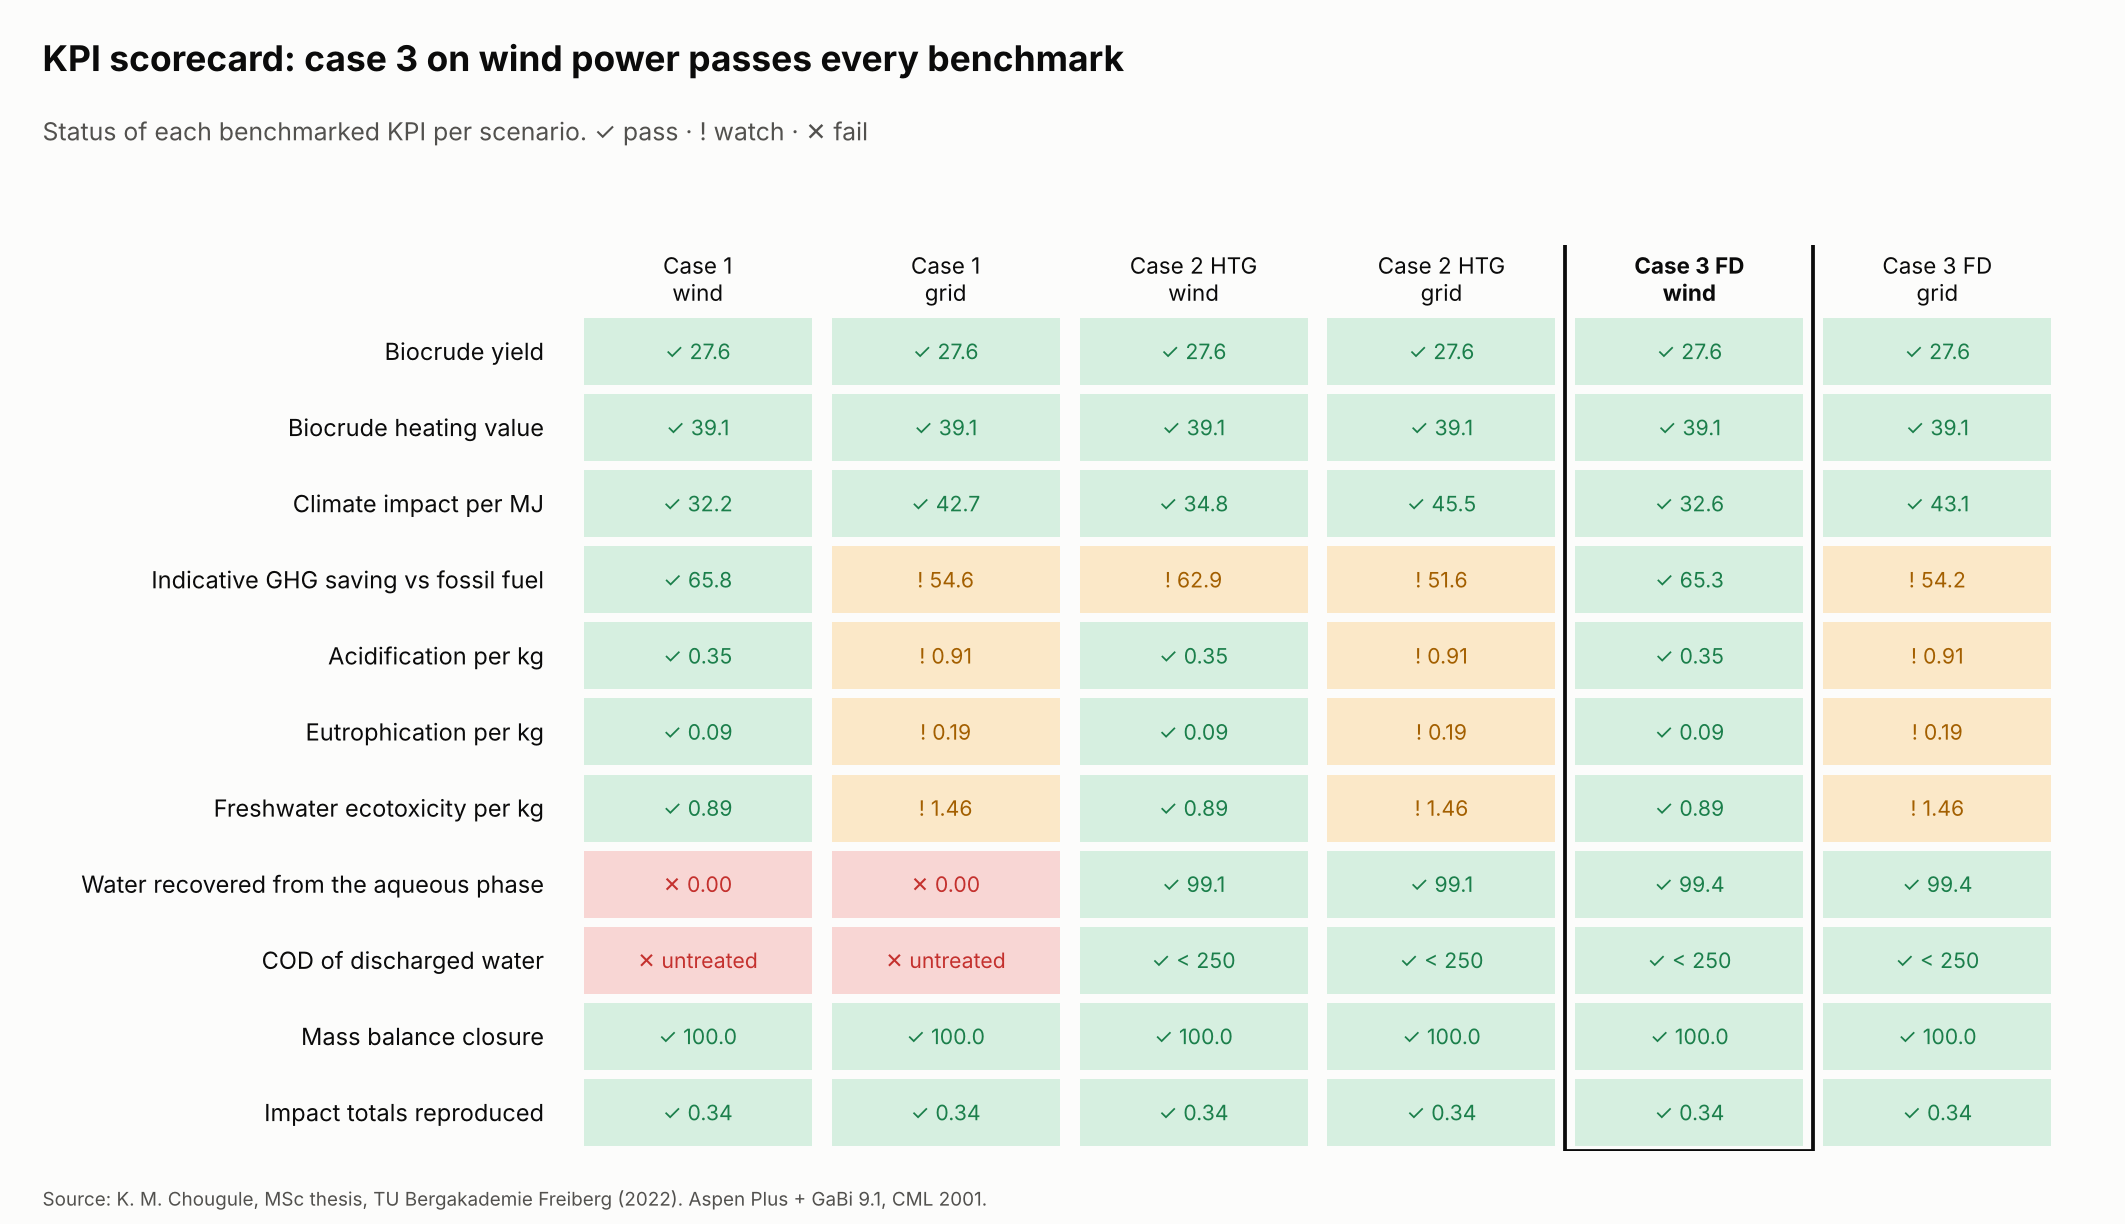
20 key performance indicators in four pillars, each with a definition, a formula, a benchmark where one exists, and a pass / watch / fail status for all 6 scenarios (src/htlmodel/kpis.py, written to results/kpi_framework.csv).
| Pillar | KPIs |
|---|---|
| Process performance | Biocrude yield · output · heating value · energy recovery · carbon recovery · nitrogen carried into the oil |
| Climate & environment | GWP per kg and per MJ · indicative GHG saving vs the RED II fossil comparator · conversion hotspot share · acidification · eutrophication · ecotoxicity |
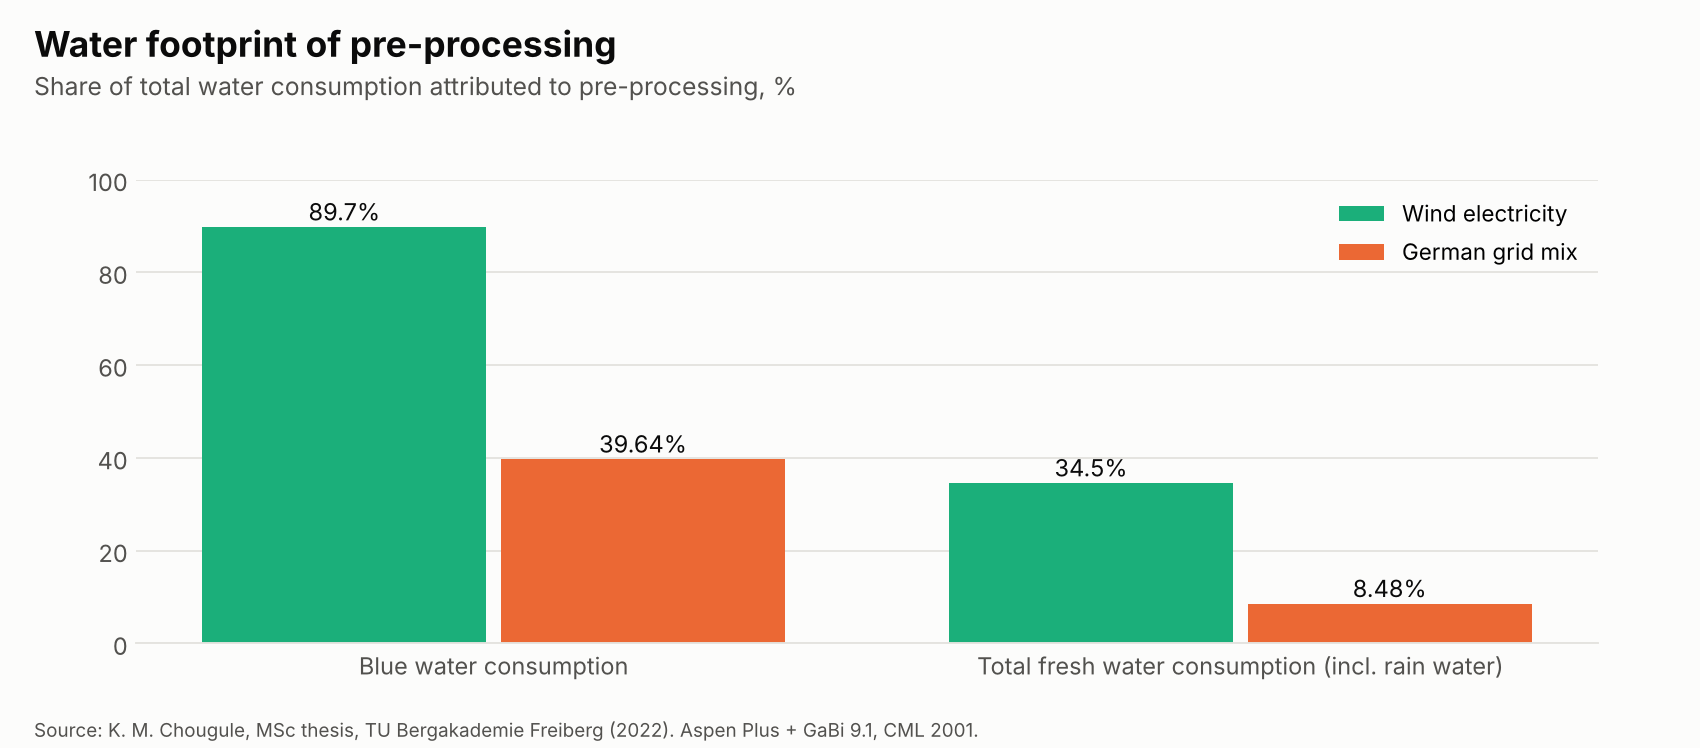
| Water & circularity | Water recovered from the aqueous phase · COD of discharged water · dry feed turned into products · value share of biocrude · blue water |
| Data quality | Mass balance closure · impact totals reproduced |
Case 3 (HTL + fractional distillation) on wind power is the only scenario that passes every benchmark. It recovers 99.4% of the aqueous phase as clean water and shows an indicative 65.3% GHG saving. That saving is cradle to gate on an HHV basis, so it is a screening value and not a RED II compliance claim.
Charts
Run python make_charts.py to redraw these in results/charts/.
 |
 |
 |
 |
 |
 |
 |
 |
 |
 |
 |
 |
Aspen Plus process models
The three flowsheets are documented in aspen/: block-by-block descriptions, stream table, operating conditions, the DECOMPOS Fortran calculator, and redrawn flowsheets.
Life cycle inventory
| File | Contents |
|---|---|
data/thesis_tables/lci_per_kg_biooil.csv |
Inventory per 1 kg bio-oil exactly as in thesis Table 4.4 |
results/lci_<case>_<electricity>.csv |
Inventory for each of the 6 scenarios, recomputed from the Aspen mass balance, with the GaBi background process for each input |
data/thesis_tables/lcia_contributions.csv |
Impact results by contributor, all scenarios and categories |
data/thesis_tables/lcia_table_4_1_as_printed.csv |
Thesis Table 4.1 exactly as printed |
data/thesis_tables/ |
Also: manure analysis, operating conditions, mass balances, off-gas, biocrude properties, air and water emissions, allocation, water footprint |
Quick start
python -m venv .venv && source .venv/bin/activate   # Windows: .venv\Scripts\activate
pip install -r requirements.txt
python run.py          # mass balance, 6 scenario inventories, impact totals, data checks
python make_charts.py  # the 13 charts
pytest                 # 13 tests
htlmodel.mass_balance.htl_balance(feed_t_per_day=...) scales the Aspen base case to any plant size.
Data checks
Rebuilding the thesis as code makes every number traceable. run.py writes results/data_checks.csv. These are the points worth correcting or clarifying in any future paper based on this work:
| Topic | Finding |
|---|---|
| Biocrude yield basis | 4,887.52 kg/h is 27.6% of the dry feed (33.5% dry ash-free). The text calls 27.7–27.9% “daf”. |
| Daily output | 4,887.52 kg/h is 117.3 t/day, not 117,301 t/day. |
| Gas in the LCI | The mass balance gives 1.75 kg gas per kg bio-oil; Table 4.4 lists 0.64 kg. Its yield labels for gas and biochar are swapped. |
| Impact table | A few rows of Table 4.1 have the diesel-mix and truck columns swapped. With one consistent assignment every printed total is reproduced within 0.3%. |
| Grid GWP | Table 4.1 gives 1.67 kg CO₂ eq; Section 4.6 says 1.76. |
| Biocrude HHV | Aspen reports 39.1 MJ/kg. The Channiwala equation (thesis Eq. 2) on the reported composition gives 27.7 MJ/kg. |
| DECOMPOS code | Table 3.2.1 has no sulfur line, so the yields sum to 0.998. |
| Conditions | 350 °C / 100 bar (Table 3.2.2) vs 300 °C / 175 bar for the RGibbs reactor (Section 3.2). |
Interactive findings page
docs/index.html is a single self-contained web page with interactive versions of every chart. It includes a switchable mass-flow diagram, an impact explorer for all categories and scenarios, the flowsheets, the inventory table and the data checks. GitHub Pages serves it at https://malleshkomal.github.io/htl-manure-lca/. Rebuild it with python site/build_site.py.
Project structure
docs/index.html      interactive findings page (GitHub Pages)
docs/process.html    animated process diagram
site/                page template and build script
aspen/               Aspen Plus flowsheets, block and stream tables, Fortran calculator
data/thesis_tables/  every table of the thesis as CSV
src/htlmodel/        mass_balance.py, lca.py, kpis.py, checks.py
tests/               pytest checks (mass balance, yields, impact totals)
results/             scenario inventories, impact totals, data checks, charts/
run.py               rebuild inventories and run checks
make_charts.py       draw the 12 charts